As a chapter leader, you already know how easy it is to get buried in reports and emails while trying to stay on top of member expectations. That’s why focusing on the right chapter leader dashboard metrics is so important. The right data at the right time helps you cut through the noise and make decisions with confidence.
Dashboards give you real-time visibility into membership, engagement, and finances. So, instead of guessing, you can see where your chapter is strong, where it’s slipping, and how it stacks up against performance benchmarks.
In this post, we’ll break down three dashboard views every chapter leader should check weekly to stay ahead and lead effectively.
New to Glue Up? Align HQ and Chapters in One Platform
Glue Up is an all-in-one association management software that connects your membership, events, finance, and communications in one place. With modules designed to automate workflows and integrations that sync with tools you already use, everything works together instead of in silos.
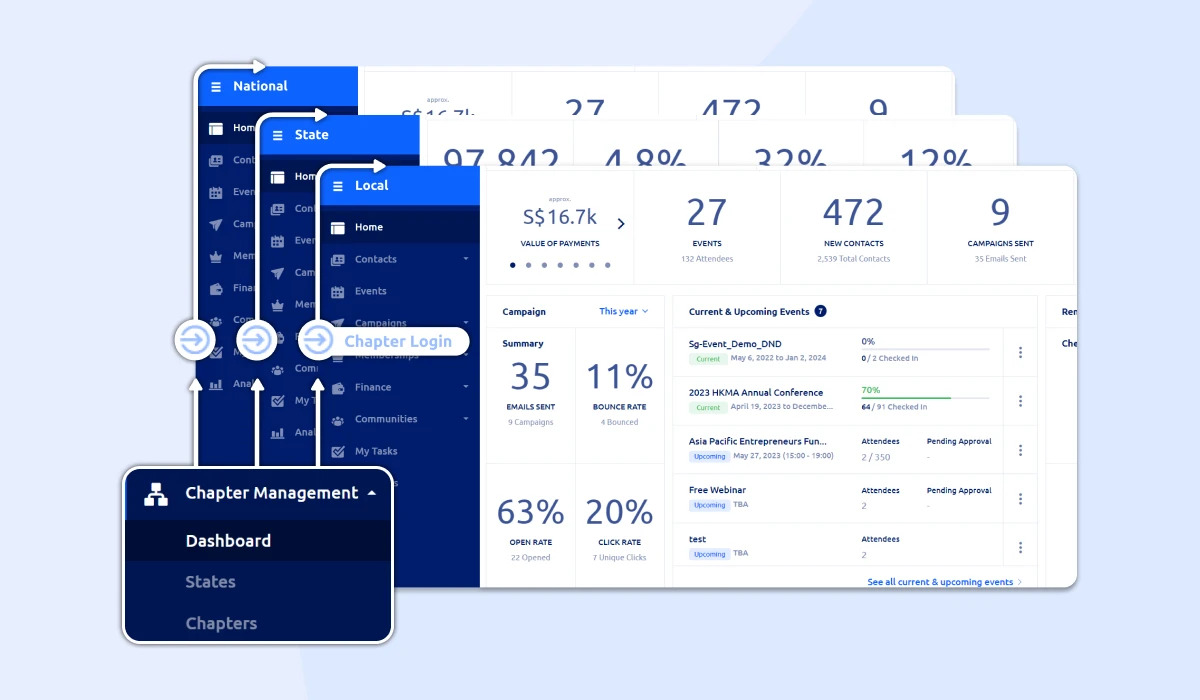
We also offer dedicated chapter management software that helps national HQs and local leaders stay aligned with real-time dashboards and reporting. So, book a demo to see how you can simplify operations and keep every chapter on track.
Key Takeaways
Chapter leader dashboard metrics turn raw data into actionable insights that guide smarter decisions at the chapter and HQ level.
Tracking membership metrics helps leaders monitor renewals, churn, and growth, ensuring chapters stay healthy and transparent.
Engagement metrics—like event attendance, email performance, and community activity—show whether members are truly participating.
Financial metrics provide clarity on revenue, expenses, and ROI, giving chapters the tools to stay sustainable long term.
Glue Up’s chapter management software unifies membership, engagement, and finance data into real-time dashboards, helping associations strengthen accountability and performance across every chapter.
What Are Chapter Leader Dashboard Metrics?
Before we get into the specific dashboard views, you must understand that not all metrics are equal. As a chapter leader, you may already see many numbers—event registrations, email opens, even social media likes. Those are useful, but don’t tell you how your chapter performs.
Chapter leader dashboard metrics are different. They focus on the KPIs that most matter to your role: membership growth, engagement, finances, communication, and overall chapter performance. Instead of one-off reports, a dashboard brings this data together in real time to see the full picture at a glance.
Research shows that organizations using data-driven decision-making are three times more likely to improve retention and 23 times more likely to acquire new members or customers (McKinsey).
What separates these metrics from generic data is context. Dashboards connect raw numbers to performance benchmarks and trends, showing you where your chapter is strong, where it’s slipping, and how it stacks up against others.
For instance: A regional engineering association doesn’t just track how many new members joined this quarter. Its dashboard compares that figure to last year’s results and other chapters in the same state. That context gives leaders confidence when reporting back to HQ and makes it easier to justify new member campaigns at the local level.
Why Data-Driven Dashboards Empower Chapter Leaders
Now that you know what separates chapter leader dashboard metrics from generic numbers, the next question is: why do they matter so much? The answer is simple. Without data, your decisions rely on instinct. With a dashboard, you can lead with clarity, spot risks early, and prove value to both members and HQ.
Here’s how data-driven dashboards empower you as a leader:
Act Quickly: Instead of waiting on monthly or quarterly reports, dashboards give you visibility into membership, engagement, and finances as they happen. Real-time reporting helps you adjust campaigns or events before it’s too late.
Spot Risks Early: Declining renewals, low event registrations, or dropping engagement metrics show up immediately, giving you time to act before they snowball.
Prove Value to HQ: Dashboards provide a clear and standardized view of chapter performance benchmarks, making it easier to align local efforts with national goals.
Plan for the Long Term: Trend data helps you look beyond week-to-week numbers. You can identify patterns in membership growth or financial health that guide sustainable strategies.
Save Time for Smaller Chapters: Even lean teams benefit. Instead of building manual reports, you free up hours for community-building and member engagement.
Metrics Every Chapter Leader Dashboard Should Include
Dashboards are only as valuable as the metrics they highlight. For chapter leaders, this means going beyond vanity numbers and focusing on the indicators that show whether your chapter is healthy, growing, and aligned with HQ priorities. The most effective dashboards for associations include three core views: Membership Metrics, Engagement Metrics, and Financial Metrics.
Let’s start with the foundation of every chapter: membership.
Membership Metrics
Membership is the lifeblood of any association chapter, so it deserves a dedicated space on your dashboard. Tracking these numbers weekly ensures you understand not only how many members you have but also whether you’re retaining them, attracting new ones, and keeping them satisfied.
Why Membership Metrics Matter
They provide visibility into your chapter’s overall size and stability.
They reveal whether your recruitment and retention strategies are working.
They allow you to forecast growth and identify long-term risks like declining renewals.
They connect directly to HQ reporting, since membership is often the key benchmark for measuring chapter performance.
Key Metrics to Track
Total Active Members: The baseline number you’re serving today.
New Member Sign-Ups: Weekly growth that indicates whether your recruitment campaigns are effective.
Renewal Rate: The percentage of members renewing compared to those expiring. High renewal rates signal strong member satisfaction.
Churn Rate: The percentage of members who did not renew. Identifying patterns here helps you act quickly.
Member Tenure: Average length of membership, showing whether you’re building long-term loyalty or struggling to keep members engaged.
How Membership Metrics Drive Chapter Success
When you track membership metrics consistently, you move from reactive to proactive leadership. Instead of realizing months later that renewals have dropped, you can intervene early with targeted communications, discounts, or added value. For HQ, standardized membership data creates transparency across all chapters, making benchmarking performance and sharing best practices easier.
What Glue Up Enables
Automated renewal workflows built into membership management software.
Segmentation tools to track member activity by tier, region, or tenure.
Centralized reporting that rolls up chapter-level membership into HQ visibility.
Engagement Metrics
Membership alone doesn’t tell the full story. A chapter with steady numbers but low participation is at risk of decline. That’s why engagement deserves its own dedicated dashboard view. These metrics help you understand how actively your members are involved and whether your programs deliver value.
Why Engagement Metrics Matter
Engagement proves members see benefits beyond holding a card.
Metrics reveal which programs, events, or communications are most effective.
Low engagement is often the first warning sign of potential non-renewals.
Engagement data makes it easier to showcase chapter value.
Key Metrics to Track
Event Attendance Rate: The percentage of members attending events compared to those invited.
Average Event Participation: Total attendees across events divided by your member base.
Digital Engagement: Open rates, click-throughs, and activity across newsletters or community platforms.
Volunteer Participation: Number of members contributing as speakers, leaders, or committee members.
Engagement Score: A combined index of event, digital, and volunteer participation.
How Engagement Metrics Drive Chapter Success
When engagement levels are high, renewals follow naturally. Members who attend events, interact digitally, or take on volunteer roles are far more likely to renew and promote your chapter. By tracking these metrics weekly, you can spot at-risk members, adjust programming quickly, and strengthen retention. For HQ, engagement benchmarks demonstrate which chapters are thriving and provide a blueprint for others to follow.
What Glue Up Enables
Automatic tracking of registrations and attendance through event management software.
Campaign performance insights from email marketing automation software.
Community activity monitoring tied directly to your CRM.
Engagement scoring to identify at-risk members using Glue Up’s AI-powered CRM.
Financial Metrics
Even the most engaged chapter can’t thrive without financial stability. That’s why financial metrics deserve a permanent spot on your dashboard. These numbers help you track income, expenses, and overall sustainability, so you’re not caught off guard by unexpected gaps.
Why Financial Metrics Matter
Healthy finances keep programs, events, and services running smoothly.
Tracking income and expenses helps leaders allocate resources wisely.
Trends reveal which initiatives or sponsorships drive the most value.
Transparent financial reporting builds trust and alignment with national leadership.
Key Metrics to Track
Revenue vs. Budget: Actual income compared to what was projected.
Expense Tracking: Total expenses broken down by events, operations, and member services.
Event ROI: Net revenue from events after accounting for venue, marketing, and staffing costs.
Non-Dues Revenue: Income from sponsorships, partnerships, or programs beyond membership fees.
Cash Flow: Weekly inflows and outflows, showing how much flexibility your chapter has to cover expenses.
How Financial Metrics Drive Chapter Success
Financial data allows you to plan for more than just the next event—it supports long-term sustainability. By tracking revenue and expenses weekly, you avoid surprises, protect your programs, and demonstrate responsible management to members and HQ. Over time, consistent financial metrics also help you set benchmarks for growth and uncover opportunities to diversify revenue streams.
What Glue Up Enables
Real-time financial dashboards powered by Glue Up’s finance management software.
Automated invoicing and online payments to keep revenue flowing smoothly.
Event ROI tracking that connects ticket sales, expenses, and sponsorship data.
Integrations with QuickBooks and Sage Intacct to keep accounting aligned with chapter reporting.
Use Dashboards to Lead Smarter With Glue Up
Membership, engagement, and financial metrics aren’t just numbers. Together, they form a complete picture of your chapter’s health and give you the tools to act confidently. When you can see who’s joining, how they’re engaging, and whether your finances are sustainable, you move from managing reactively to leading strategically.
Glue Up makes this possible by connecting all your chapter data in one place. Instead of pulling reports from separate tools, you get dashboards powered by the same platform you use for membership applications, event registrations, communications, and finances. That means every number you see is current, accurate, and tied to real workflows.
For larger associations with multiple chapters, Glue Up’s chapter management software adds another layer of visibility. HQ can roll up data from every local chapter into a standardized view, making it easier to compare performance, share best practices, and provide support where it’s needed most. Leaders at every level see the same metrics, updated in real time.
So, book a demo today and see how Glue Up dashboards can help your chapters stay accountable, grow membership, and deliver lasting value.
Frequently Asked Questions
What are the most important metrics for chapter leaders?
The three core areas are membership, engagement, and financial health. These cover how many members you’re serving, how active they are, and whether your chapter is sustainable.
How often should dashboards be updated?
Dashboards should update in real time or at least weekly. This ensures you can act on trends—like declining renewals or low event registrations—before they become bigger issues.
Can smaller chapters benefit from a dashboard?
Yes. Even lean teams gain efficiency because dashboards eliminate manual reporting. Smaller chapters can use pre-built views for membership, finances, and engagement without a dedicated analyst.
How can dashboards integrate with HQ reporting?
A centralized system like Glue Up connects chapter data with HQ reporting to give national or regional leadership consistent metrics across all chapters, helping them benchmark performance and support local leaders.
What role do performance benchmarks play in dashboards?
Benchmarks show whether your chapter is ahead, behind, or on track compared to others. They add context to raw numbers, so you’re not just reporting membership totals—you’re showing how your chapter performs relative to peers.