Picture the board room. Coffee is cooling, the finance packet is thick, and the first question lands fast: why did renewals miss target when the events calendar was full, and the pipeline looked healthy a month ago. You have the answer, but it is not in the static spreadsheet.
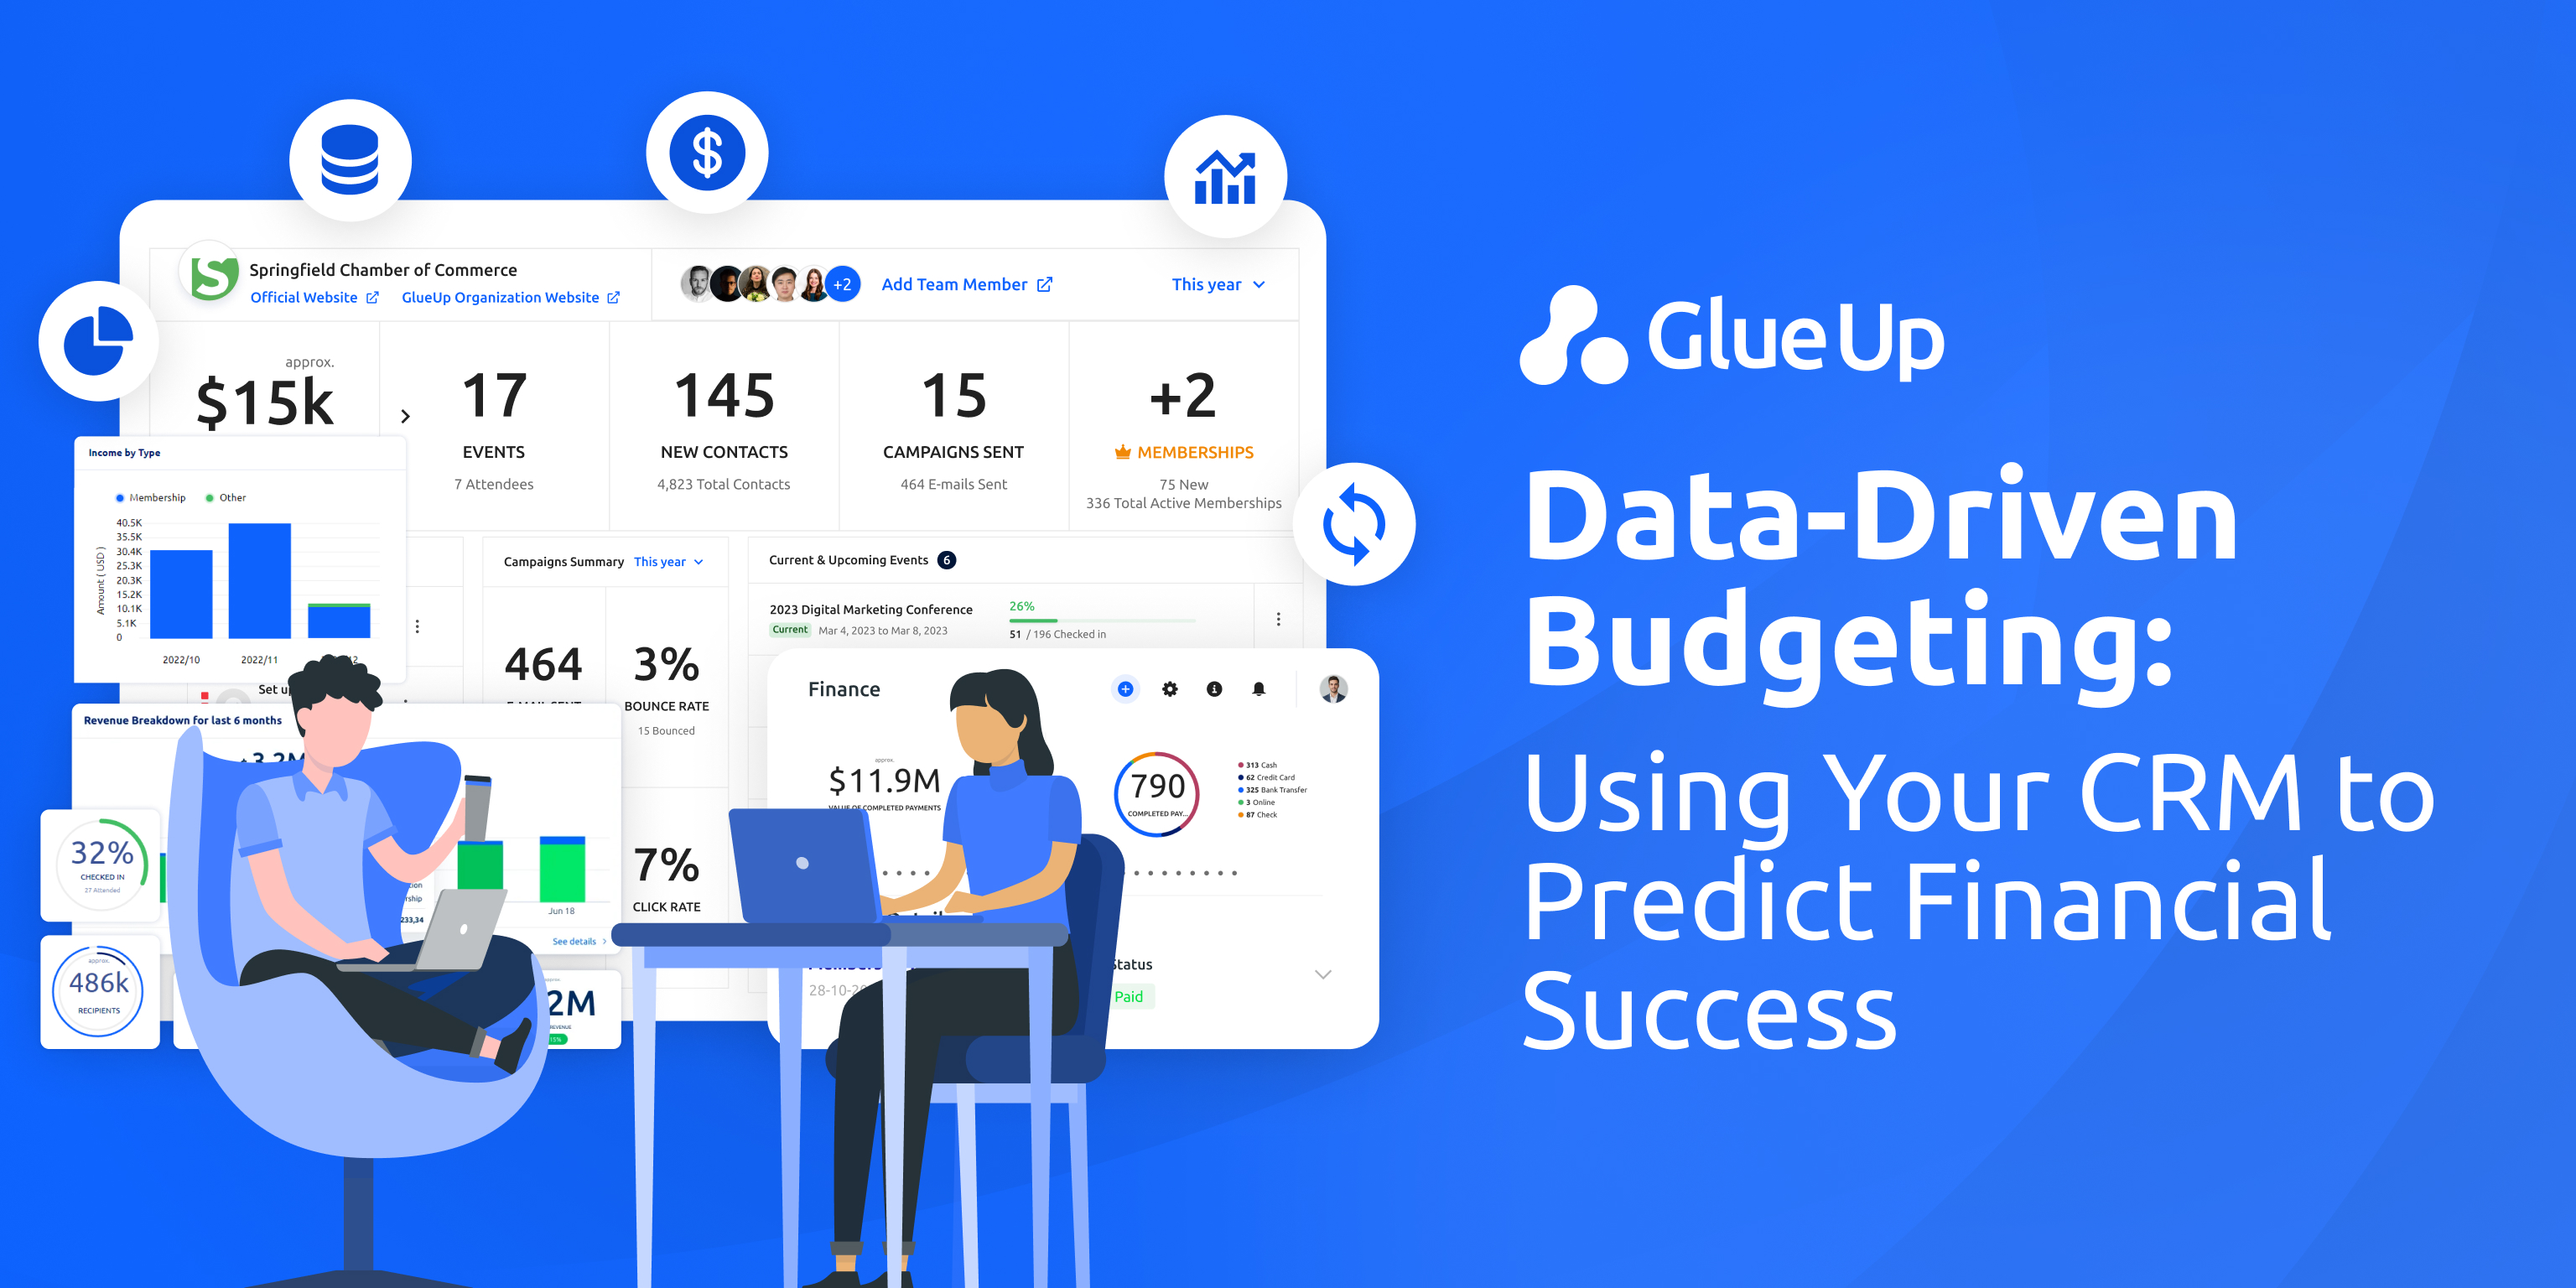
It is inside the CRM, where membership tenures, renewal dates, stage probabilities, and event registrations change every day. This is where data-driven budgeting stops being a buzzword and becomes a working system. When your budget is fed by live drivers from your CRM, you stop guessing and start forecasting. You do not wait for year end to find out what went wrong. You see it coming, and you adjust early.
What follows is a practical, CFO friendly, program manager friendly, board ready path for associations, chambers of commerce, and similar organizations to build data-driven budgeting as a repeatable habit. We will map CRM fields to revenue lines, build a rolling twelve-month model, choose the metrics that predict member lifetime value, and outline the integrations that keep budgets honest.
The outcome is simple to describe and satisfying to run. You get a weekly view of bookings, billings, and cash that ties back to real people, real packages, and real events. You get fewer unpleasant surprises. You get decisions that feel cleaner.
Key Takeaways
Data-driven budgeting turns your CRM into the financial forecast engine. Associations and chambers can stop relying on static spreadsheets and start forecasting in real time by feeding renewal data, sponsorship pipelines, and event registrations directly from the CRM into rolling twelve-month models.
Mapping CRM fields to financial drivers aligns every department. When membership, sponsorship, event, and expense data are tied to specific CRM fields, everyone operates on the same truth. Forecast debates shift from opinions to measurable drivers.
Rolling forecasts replace annual guesswork with adaptive clarity. Updating forecasts monthly keeps a constant twelve-month horizon. This practice detects renewal dips or sponsor delays early, allowing leadership to adjust quickly rather than waiting for year-end surprises.
Data quality and integration define forecast accuracy. Clean, timely, consistent CRM data is the foundation of credible budgets. Scoring data quality across completeness, validity, uniqueness, timeliness, and consistency prevents costly errors and keeps financial projections trustworthy.
Data-driven budgeting builds confidence. With a few simple habits, member-based organizations can create transparent, board-ready budgets. Glue Up’s CRM and finance tools make this achievable for teams of any size.
Quick Reads
What Data-Driven Budgeting Means for Associations
Most associations still build a once-a-year plan and spend the next eleven months explaining variances. The world moves too quickly for that. Sponsors shift priorities, members delay renewals, and an anchor event can surge, or stall based on one speaker announcement. Data-driven budgeting treats all of this as dynamic. It connects your operational truth to your financial plan so the plan is never frozen.
In practice, you identify the drivers that move each line of your budget. Renewals move dues. Conversion rates move sponsorships. Registration curves move event tickets. Headcount moves operating spending. Then you map those drivers to the CRM fields that capture them.
Once that map is in place, you reforecast on a rolling twelve-month horizon. You replace the old months with actuals, extend the horizon one month forward, and update assumptions with what the CRM just saw. This is how data-driven budgeting stays fresh, relatable to staff, and trustworthy to your board.
The big shift is not a flashy tool. It is a mindset that the budget must follow the drivers, not the other way around.
From CRM Fields To Forecast Lines with Data-Driven Budgeting
Here is the translation layer that turns daily activity into budget math. Copy this into your planning notebook and customize to your programs.
Membership Dues
Core fields in CRM: member id, join date, renewal date, tier, dues amount, auto renewal flag, status, payment method, tenure in months, engagement score
Driver logic: Renewal probability by cohort and tenure, multiplied by average revenue per member in that tier, adjusted for payment method reliability and any planned price changes
Forecast line: Monthly bookings of renewals and upgrades, monthly cash collection, and the billings schedule if you split dues across periods
Sponsorship and Partner Revenue
Core fields in CRM: opportunity amount, stage, probability, expected close date, sponsor segment, product or package, last activity, event anchor
Driver logic: Weighted pipeline math. Sum opportunity amount multiplied by stage probability by month, apply conversion lift for sponsors attached to anchor events, and apply slip factors for long inactive deals
Forecast line: Bookings by month that feed invoice schedules and expected cash dates
Event Ticket Revenue
Core fields in CRM or event module: event id, event date, ticket types, price points, registrations to date, waitlist, discount rate, channel attribution
Driver logic: Registration curve fitted to days before event, multiplied by net price after discounts and fees. Update weekly as the curve moves
Forecast line: Ticket bookings by event month with a simple waterfall to cash, plus a separate event P and L that pairs revenue with expenses
Education, Certification, and Other Non-Dues
Core fields in CRM: product id, list price, active subscribers or enrollees, churn rate, trials, conversion rate
Driver logic: Monthly recurring revenue logic with cohort adds and churn, plus planned upsells
Forecast line: Monthly recurring revenue and cash
Operating Expenses
Core fields in HR and procurement: headcount plan by function, comp bands, vendor contracts, software by seat, facilities square footage, event COGS per attendee
Driver logic: Headcount roll forward with start dates and attrition scenarios, unit costs tied to volumes like attendees and emails sent, and vendor step ups based on contract dates
Forecast line: Monthly OpEx and COGS with variance tracking against GL actuals
When you put these maps in place, data-driven budgeting stops feeling abstract. Finance is not asking program teams for guesswork. Program teams are not arguing with finance about reality. Everyone looks at the same fields. The debate shifts from opinions to drivers.
Build A Rolling Twelve Month Model with Data-Driven Budgeting
You do not need an army of analysts. You need a cadence and a clean process.
Step One. Choose a Cadence
Common choices are four actual months plus eight forecast months, or eight plus four. Pick one and stick to it. Agree that at month end you close actuals, drop the closed month from the forecast, and add a new month at the end. That keeps a full year in view.
Step Two. Stage Your Data
Set up a nightly snapshot that pulls a small, well-chosen to set of CRM tables into your planning workbook or FP and A tool. Opportunities, membership subscriptions, event registrations, and products are enough to start. Join those to your accounting actuals. That single join is the bridge between what the CRM believes will happen and what actually happened.
Step Three. Build Driver Tabs
Create small tabs that focus on one driver at a time. Renewal curves by tenure band and tier. Stage probabilities with realistic definitions of each step. Registration curves based on last year’s pattern adjusted for price and promotion. Unit costs for events and marketing. Do not bury assumptions in the middle of a giant sheet. Put them where anyone can see and edit them.
Step Four. Assemble Schedules
Turn drivers into bookings. Turn bookings into billings. Turn billings into cash. Label where the timing differences matter. Staff will understand bookings. Finance lives in cash. Your board wants to see both. Data-driven budgeting respects the three statements view and allows finance to reconcile the forecast with the GL each month.
Step Five. Run Scenarios
Add three simple switches across the model. Base, stretch, and downside. Stretch adds a few points of retention, a modest lift in late-stage sponsor conversion, and a better event curve for one or two anchor programs. Downside takes the opposite path. These toggles give executives a feel for sensitivity. They turn data-driven budgeting into a decision lab rather than a printed report.
Step Six. Automate the Reforecast
The rule is short. When actuals close, the model rolls forward. Drivers update. Variances are explained. Deltas above five percent get human discussion. Everything else is noise. That habit is where accuracy improves. That habit is where teams learn to trust the model.
Step Seven. Build Board Ready Views
You need three weekly charts and two monthly tables. Weekly, show pipeline health for sponsors, a renewal forecast versus last month, and event registration velocity against plan. Monthly, show budget versus actual and forecast versus last forecast. Place these five views on one page. That is data-driven budgeting your board can read in minutes.
The CLV Lens That Makes Data-Driven Budgeting Smarter
Customer lifetime value is not only for ecommerce and telecom. For associations it is member lifetime value, and it belongs in the budget. When you know the expected lifetime value of each tier or persona, you can set realistic acquisition targets, spend caps, and cross sell goals.
A simple and useful version looks like this.
Start with average revenue per member per month by tier
Multiply by expected tenure in months for that tier and persona
Adjust for discount behavior and payment method reliability
Subtract acquisition and servicing costs you can attribute
To estimate tenure, use cohort survival curves from your CRM. Members who pass the first renewal often stay longer. Members with higher engagement scores renew at better rates. Members who attend at least one flagship event each year show stronger loyalty.
Your CRM knows this because it tracks logins, event attendance, committee roles, and help desk activity. When data-driven budgeting uses that engagement data to tune tenure, your plan can fund the programs that truly lift retention rather than the programs that only feel good.
You can go deeper with probability models and Bayesian updates, but do not let perfection block progress. A good CLV estimate that updates each quarter will beat a beautiful calculation that lives in a slide deck.
Data-Driven Budgeting Tools That Play Well With CRM
You have two paths. Some teams keep a spreadsheet core and add light automation. Other teams move to a modern FP and A platform that connects to CRM and accounting. Both are valid. The right answer depends on team size, complexity, and audit requirements.
Spreadsheet Core with Smart Plumbing
Use scheduled exports or a warehouse connector to bring small, tidy tables from the CRM into the model
Keep assumptions in driver tabs with clear owners
Use simple checks that flag stale close dates, missing renewal dates, and improbable stage ages
Publish weekly snapshots as locked PDFs for leadership and board folders
FP and A Platform
Choose a tool with native connectors to common CRMs and ERPs
Map drivers once and reuse them across scenarios and versions
Route budget ownership to functional leaders with role based access
Keep version control and audit trails for board and auditor comfort
Whichever path you pick, data-driven budgeting improves when integration is boring. The model updates without heroics. Finance reviews deltas, not raw extracts. Staff talks about drivers, not spreadsheet tabs.
Measure Data Quality Like a Financial Risk
Every budget lives and dies on data quality. The fastest way to raise quality is to measure it the same way you measure cash flow. Give it a monthly score and make someone the owner.
Use five dimensions that are simple to understand and simple to improve.
Completeness: Do we have close dates on open opportunities, renewal dates on active members, and event dates on all event records. Aim for at least ninety eight percent completeness on required fields.
Timeliness: Are records updated in the last two weeks. If a sponsor deal sits untouched for a month, drop its probability until activity resumes.
Validity: Are picklists used correctly. Are email addresses valid. Are prices and discounts within allowed bounds.
Uniqueness: Do we have duplicates for the same company or member. Duplicates break outreach, ruin cohort analysis, and overstate pipeline.
Consistency: Do the CRM and the accounting system agree on status and amounts for closed deals and active subscriptions. Reconcile monthly.
Score each dimension. Publish the score next to the forecast. As data-driven budgeting takes hold, you will see a healthy feedback loop. Cleaner fields lead to tighter forecasts. Tighter forecasts invite more trust. More trust wins more cooperation for data cleanup.
One note on the business case. The dollar cost of bad data has been documented across industries with large, eye watering figures. You do not need a scare tactic. Show the specific costs that your leadership already feels. Duplicates waste staff time. Stale close dates lead to miss forecasts and budget cuts. Missing renewal dates create awkward calls. That is enough urgency.
Pitfalls To Avoid When Running Data-Driven Budgeting
Over weighted late-stage pipeline: If the only clean stage is the last one, you will live on a roller coaster. Define early stages clearly and require activity-based movement so the model sees reality earlier.
Annual thinking inside a monthly process: A rolling model only works when you treat the monthly reforecast as normal. If every update becomes a negotiation, the habit will die. Agree on rules for when to revisit targets and when to accept variance.
Models that skip billings and cash: Bookings are not revenue. Revenue is not cash. Build the waterfall each time. Your finance lead will thank you.
Integrations that rely on spreadsheets alone: If you must export and paste for every update, the system will stall when you get busy. Even a simple scheduled export is enough to keep data-driven budgeting healthy.
Vanity metrics that do not connect to money: Page views are not dues. Likes are not sponsorships. Keep the model focused on drivers that roll into bookings.
Field Notes from A Composite Case
Imagine a regional association with six thousand members and three flagship events. The team builds a first pass of data-driven budgeting in four weeks.
Week one: they define drivers and gather fields. Renewals are grouped into tenure bands, event curves are fitted from last year, and sponsor pipeline is cleaned enough to trust stage probabilities.
Week two: they create driver tabs and a booking to cash waterfall. Finance connects the model to the accounting actuals and agrees on reconciliation rules.
Week three: they add scenarios. The base case shows a dip in sponsor bookings in the second quarter tied to an inactive stage. The downside case shows the impact of a ten percent drop in registrations for the fall conference.
Week four: they rehearse a board view. Five charts on one page. Two tables beneath. The board meeting runs thirty minutes faster than usual. The conversation moves to actions. Call the five sponsors who slipped. Move the early bird to create a stronger slope on the event curve. Fund the onboarding emails that lift first year renewals.
Three months later, the forecast accuracy tightens. The data quality score rises from seventy eight to ninety two. Staff begin to volunteer ideas that move drivers rather than defending gut feel. It is not magic. It is practice.
Quick Starts for Small Teams Who Want Data-Driven Budgeting
Start with renewal cohorts and sponsor pipeline: You will get eighty percent of the forecasting benefit by weighting your pipeline and modeling renewals by tenure. Add events after you prove the habit.
Reforecast monthly even if the first version is rough: Repetition beats elegance. The second version will be better. The third will be good. The fourth will feel natural.
Put one chart on the wall: Registrations by days to event compared to last year. Everyone sees it. Everyone owns the slope.
Give data quality a number: Make it a friendly competition across teams. Publish the winner each month.
Tie wins to behaviors: When renewals rise after a cleaner onboarding, celebrate the team that wrote the emails and the team that kept renewal dates accurate. That is how data-driven budgeting becomes culture.
Frequently Asked Questions About Data-Driven Budgeting
What is data-driven budgeting for an association?
It is a planning method where budget lines are driven by the operational facts in your CRM. Renewals, sponsorships, event registrations, and education programs feed bookings, then billings, then cash. You update the plan monthly on a rolling twelve month horizon.
How often should we reforecast?
Monthly is the sweet spot. If you run many events or campaigns, a light weekly checkpoint helps keep curves honest. Quarterly is possible for smaller teams but risks stale signals.
Which CRM metrics best predict lifetime value?
Tenure bands, average revenue per member by tier, engagement frequency, payment reliability, and participation in flagship programs. When these are combined, they explain a lot of renewal behavior.
How do we connect CRM to accounting without a big data team?
Begin with a small scheduled export of a few clean tables. Use predictable formats and simple checks. If you later adopt an FP and A tool, map those same tables once and keep the habit.
Do we need advanced statistics to get value?
No. Weighted pipelines, cohort retention, and registration curves are straightforward and powerful. You can add complexity only when the team is ready.
Closing The Loop with Glue Up
A plan on paper does not move a budget. The habit that feeds the plan does. If your CRM and event system already capture renewals, stage probabilities, and registration data, you have everything you need to start data-driven budgeting this month. If you want fewer surprises at board time and clearer choices between programs, build the translation layer from fields to drivers, pick a cadence, and run.
Glue Up customers often begin exactly there. Membership records give renewal dates and tenure. Event tools provide daily registration velocity. Sponsorship opportunities show stages and expected close dates. Finance teams connect those drivers to the plan and watch the model teach the organization how to see risk earlier and act faster. The conversation moves from why last quarter missed to what next quarter needs.
If you would like a board ready snapshot and a simple forecast workbook tailored to memberships, sponsors, and events, book a demo. Bring your current plan. Bring your questions. Bring two months of exports if that is what you have. We will show you how data-driven budgeting feels when the CRM is the engine.


