The email came too late. One of your chapters quietly shut down. Dues stopped coming in, and their events flopped. Volunteers faded. There were no red flags, no alerts, just a growing silence that HQ noticed only weeks later.
This is the quiet chaos that happens when associations operate without real-time visibility. No one sees the full picture until it’s too late, funding drops, engagement dips, and chapters fall through the cracks. It's not about a missing report. It's about a missing warning system.
Real-Time Dashboards for Associations Aren’t a Tech Perk. They’re a Leadership Mandate
Most dashboards in associations act like rearview mirrors. They show what happened last month after the damage was done. Chapter leaders use their systems. HQ depends on emailed spreadsheets or delayed uploads. Everyone’s working off a different version of the truth.
But leadership doesn’t work in delay mode. You can’t support chapters, allocate funds, or intervene early if you're blind to what’s happening right now. Real-time dashboards aren’t about shiny features. They’re about aligning the entire organization around live data, shared priorities, and proactive action.
Quick Reads
- AI-Powered CRM in Membership Management
- Partnership vs Sponsorship: What’s Best for You?
- How AI is Revolutionizing Event Planning
- Comparing the Best Association Management Software
- Transform Your Financial Management with Tools
- How to Promote Membership in the Most Effective Ways
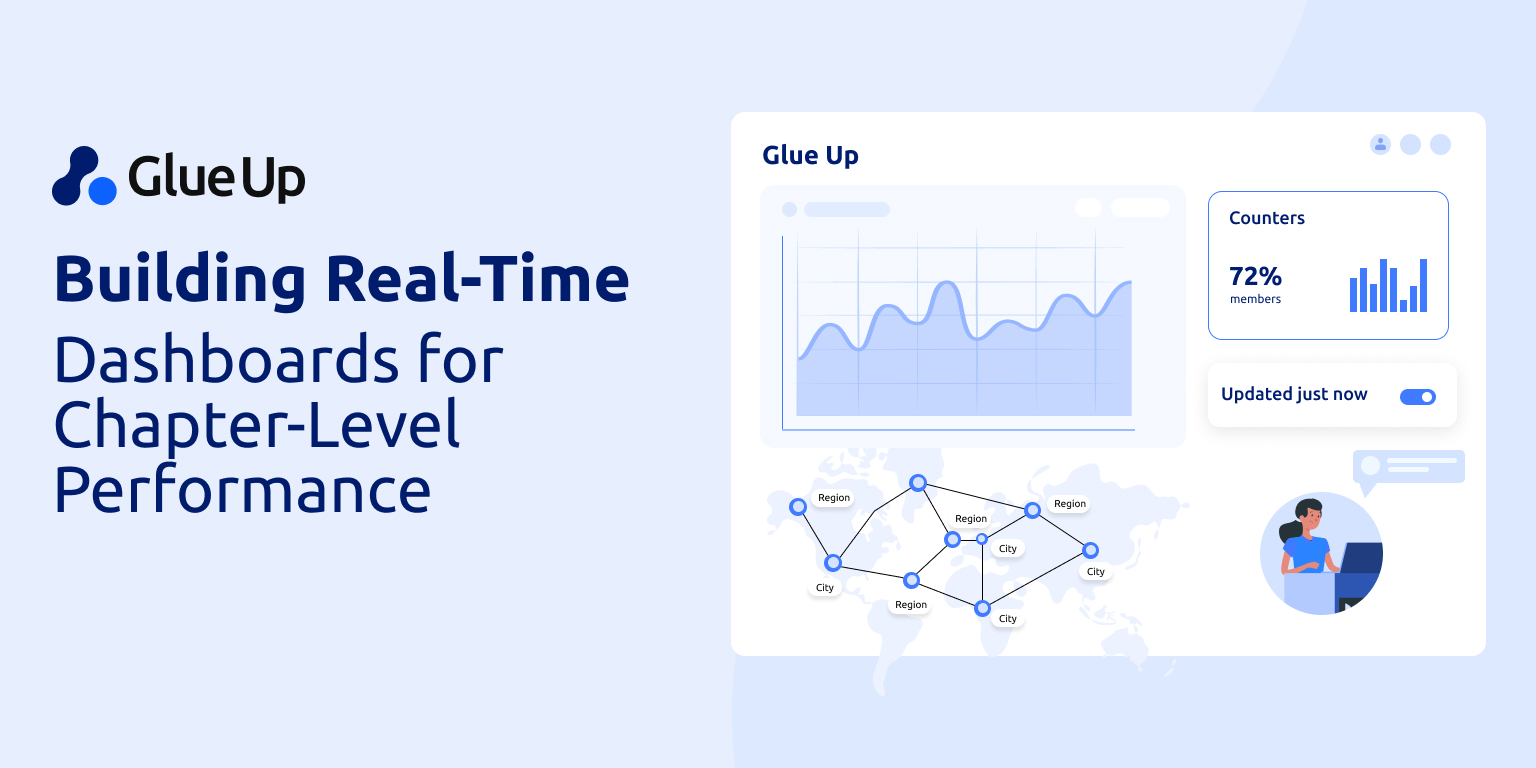
Real-Time Dashboards for Associations: What the Best Ones Actually Show
A good chapter dashboard doesn’t just show numbers; it shows where to act. The most effective ones surface:
- Membership metrics: growth trends, renewal rates, satisfaction scores
- Event success: RSVPs, actual attendance, revenue generated
- Financial health: dues collected, late payments, outstanding balances
- Engagement signals: email open rates, community activity, form responses
- Comparative trends: which chapters are excelling, and which are falling behind
Without this visibility, one underperforming chapter can go unnoticed for months until a member leaves or a sponsor pulls out. A dashboard should surface that risk early, not after it’s baked into your annual report.
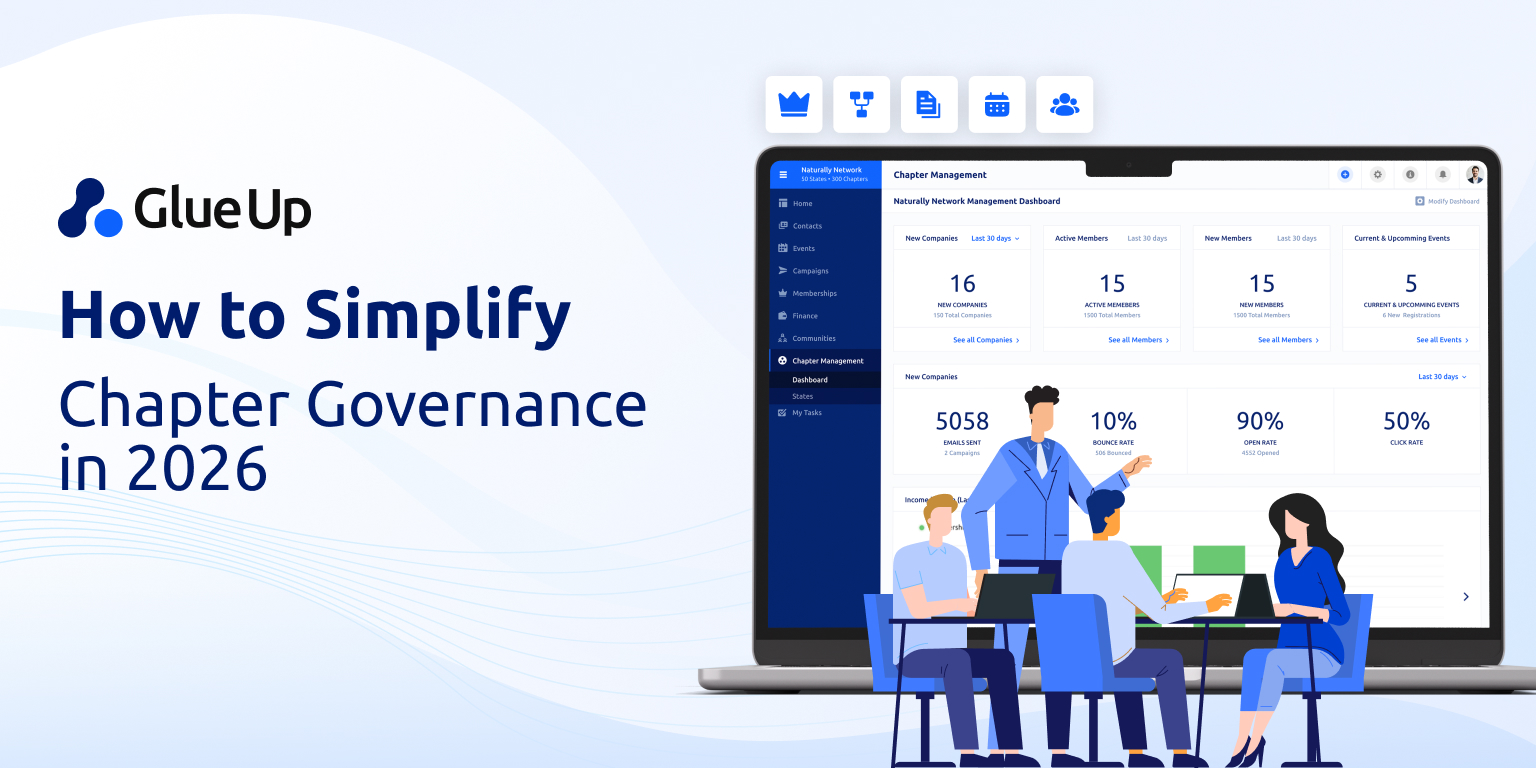
Glue Up’s Chapter Management Dashboards: Real-Time, Chapter-First, Action-Ready
Here’s what sets Glue Up’s dashboards apart from generic reporting tools:
- Live data updates: No more waiting for monthly Excel files. You see changes as they happen.
- Role-based access: Chapters see their data, HQ sees everything. No confusion, no overlap.
- Visual + actionable: Trends, alerts, and filters built to prompt action, not just display information.
- Tied to real workflows: Membership, payments, events, and engagement data are pulled straight from the Glue Up platform.
Already using Glue Up’s chapter management tools? Ask your account manager to activate real-time dashboards and start seeing what your chapters are doing right now.
Building Real-Time Dashboards for Associations Requires Trust, Not Just Tools
Dashboards don’t work if people don’t trust the data. If the chapters think the numbers are wrong or HQ thinks the data is incomplete, no one uses it. That’s why real-time visibility only works when it’s paired with shared standards, clear onboarding, and solid governance.
Studies in government and healthcare show the same thing: user adoption grows when data feels accurate, fair, and useful. Associations are no different. Chapter buy-in happens when leaders know the dashboard reflects their effort and when HQ uses the data to support, not police.
This isn’t about monitoring chapters. It’s about leading with confidence, alignment, and transparency.
Real-Time Dashboards for Associations: Before and After
Let’s make it plain. Here’s what life looks like before and after you activate real-time chapter dashboards:
| Before | After |
| Chapters email reports manually | Data flows automatically |
| HQ sees metrics weeks or months later | HQ sees activity as it happens |
| Issues are spotted late | Alerts highlight problems early |
| Excel sheets and guesswork | Dashboards with filters, KPIs, and visual trends |
| Decisions made on outdated info | Decisions based on live performance |
With Glue Up, chapters don’t just sync their data. You trigger workflows, spot risks in real time, and finally have a shared insight layer to guide support and strategy.
Ready to See Chapter Performance Live? Glue Up Makes It Real
You don’t manage chapters; you invest in them. Every dollar, event, and engagement effort is bet on local success.
Real-time dashboards don’t just tell you what happened. They show you what’s happening, what needs attention, and where support can make the biggest difference. Visibility isn’t optional anymore; it’s part of leading well.
Already using Glue Up? Enable real-time dashboards in your Glue Up Manager App or ask your account manager to activate them for your account. You’ll never look at chapter performance the same way again.


